 Tikpilot
Monitoring a fleet of MikroTik routers
Fifty sites, each behind its own provider, and all of them blink occasionally. What counts as down, why a threshold without a hold time wakes you for nothing, and how to get alerts you will not want to switch off on day two.
First question: what "not working" means
This looks like quibbling over words until it happens to you. A site can fail to answer the panel while working perfectly well: the till prints, people are online, a colleague has WinBox open. It is just the management interface that is unreachable, because the link is saturated or a service on the router fell over.
The difference between those two cases is several hours of driving. One of them means going to the site or calling someone there, the other means fixing connectivity from your desk. Monitoring that lumps them together and says "offline" makes you work that out by hand every time.
So the right order of questions is: is the site alive at all (ICMP answers that), and only then, can it be managed. The first is the status, the second is a marker next to it.
Second question: hold time
A threshold without a hold time is an alarm clock that goes off in a draught. The link blinked for fifteen seconds, an alert arrived, a minute later another one about recovery. Three such sites in the fleet and alerts start going to the archive unread, taking with them the one alert the whole thing was built for.
So a rule needs two numbers, not one: the threshold and how long it has to hold. "Unreachable for more than fifteen minutes" is useful, "unreachable" is not. Quiet hours and a digest are worth setting up separately, so that the night brings one message instead of forty.
What to measure besides availability
- Latency and loss measured by the router itself towards an external target. By the site, not by the server: otherwise you are measuring your link to it rather than its link outwards.
- Uplink throughput as an average between polls. A one-second spike says nothing; a five-minute average shows a saturated link.
- Free memory as a share of the board, not in megabytes. Eleven megabytes is a third of a hAP lite and the last crumbs on a CCR.
- CPU load averaged over half an hour, not the instant value.
- The age of the last backup, and a syslog that went quiet. Formally not monitoring, in practice the same thing: something broke and is keeping silent about it.
- Disk space on the monitoring server itself. A classic: the disk fills up, the database stops accepting writes, and monitoring goes silent.
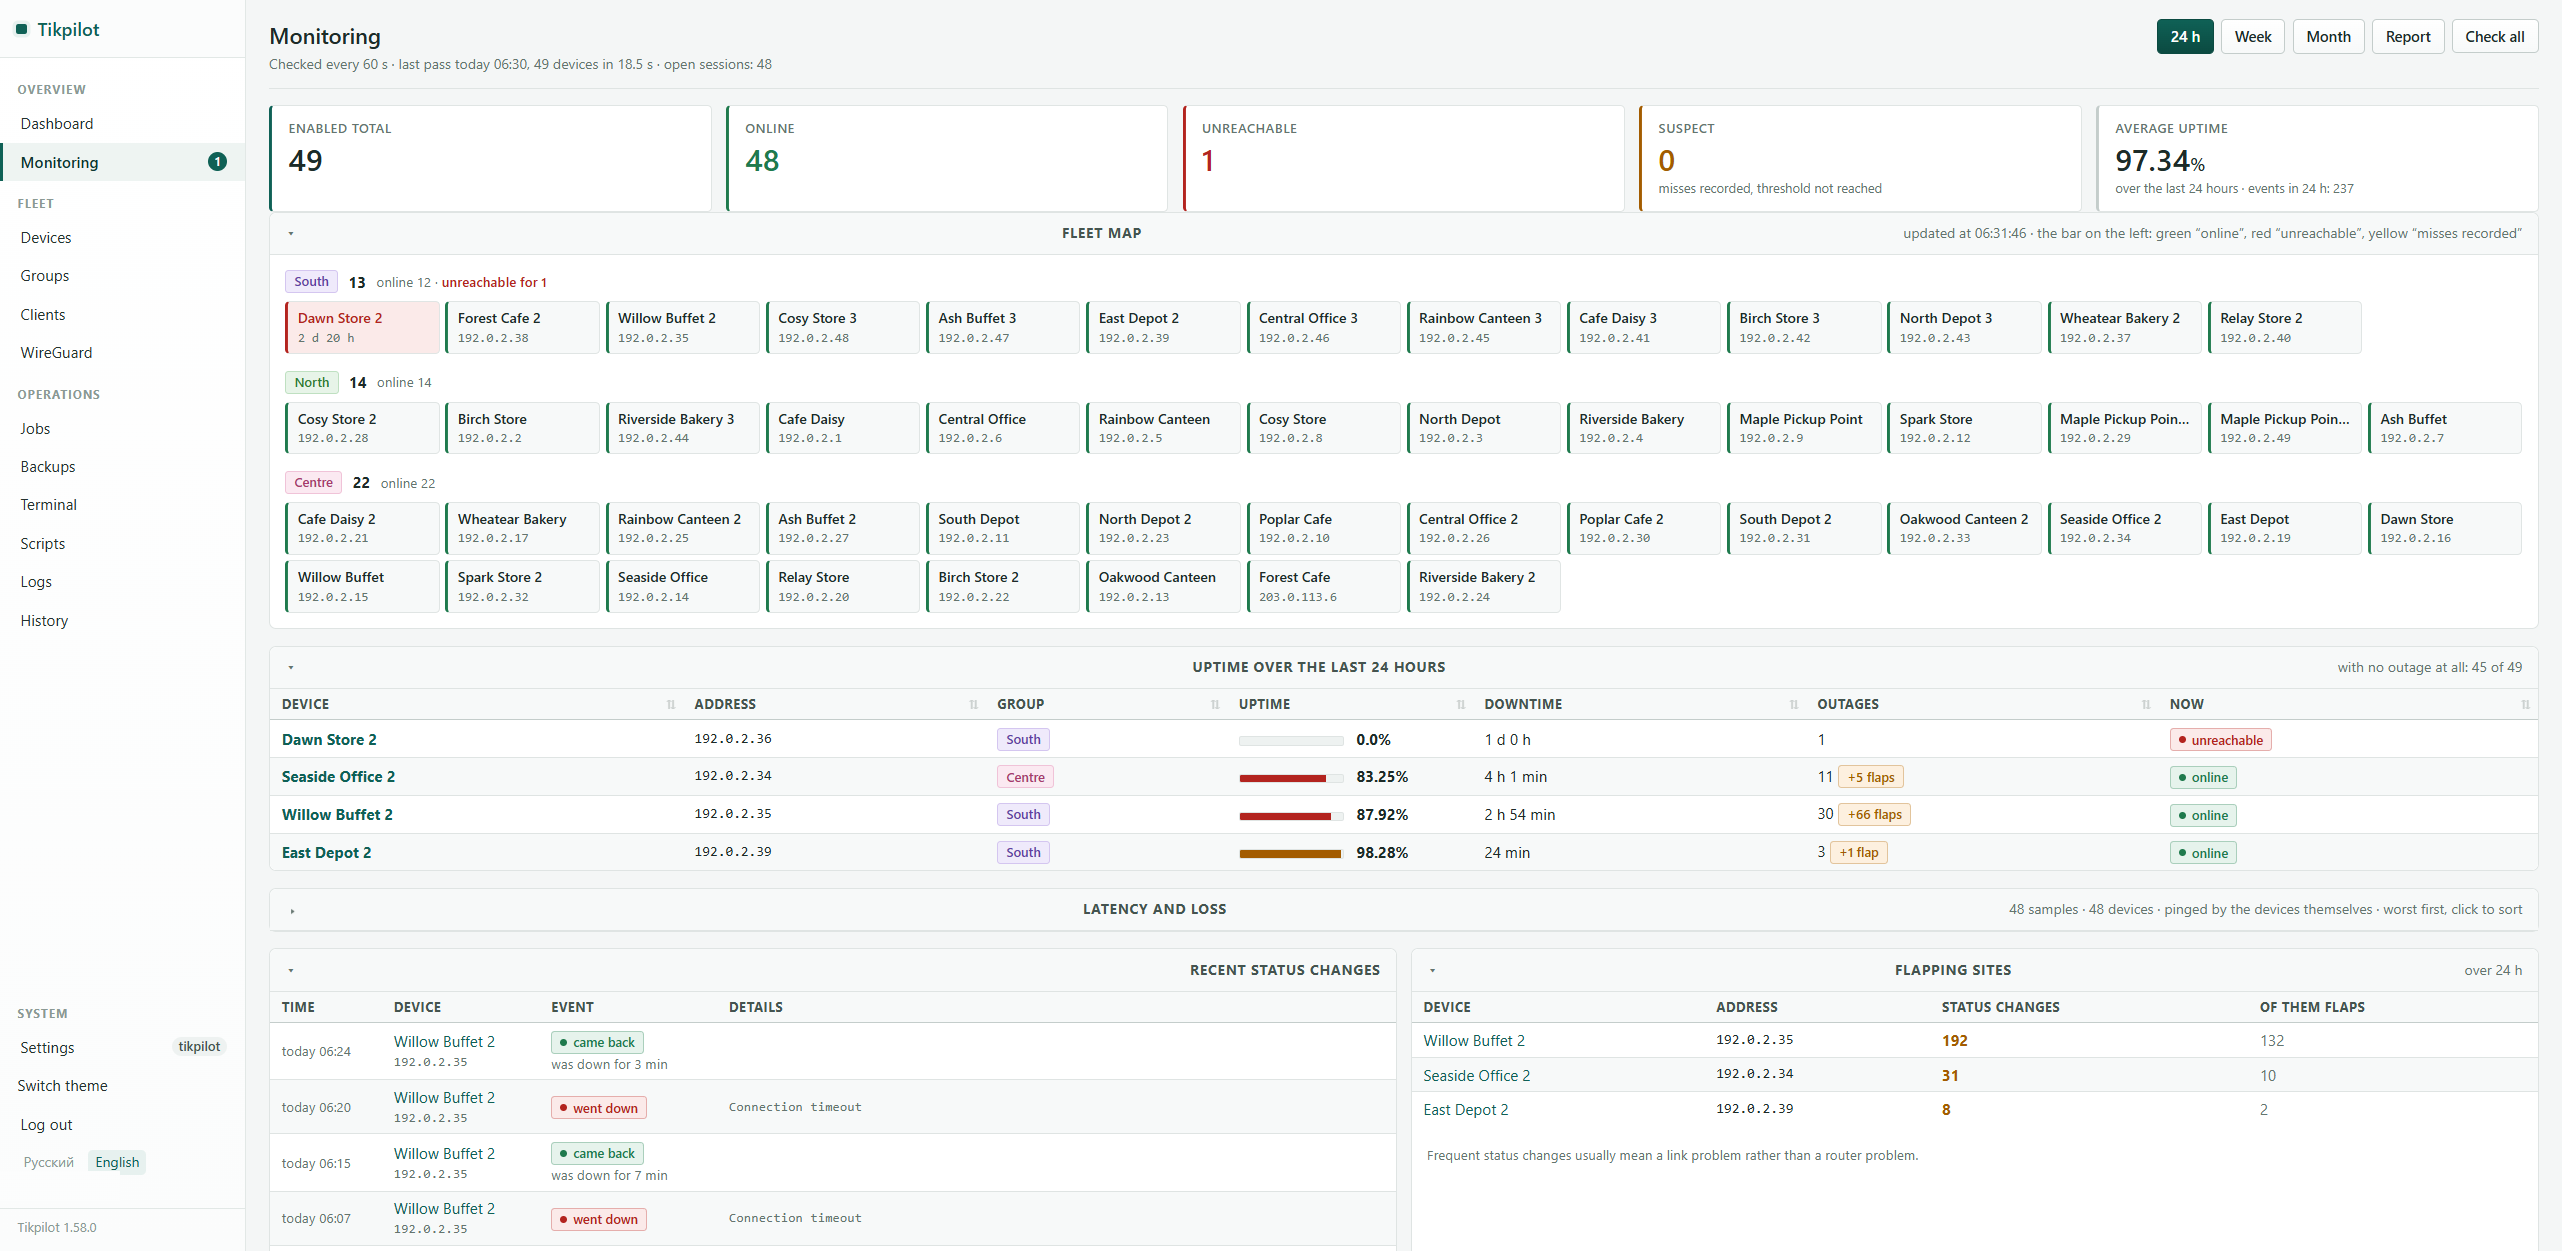
Taken from a live fleet of 49 routers; names and addresses are replaced by the panel itself.
Third question: where to look in the morning
A dashboard where everything is green gets read for a week and then ignored. The opposite is more useful: a list of what to deal with today, and emptiness when there is nothing. Unreachable and flapping sites, packet loss, stale backups, a syslog that stopped arriving, memory pressure, services open to the world, available updates, all in one list sorted by severity. When everything is calm the block is simply not there.
The report someone will ask for
Sooner or later the question comes: how long was that site down last month. It is asked not by an engineer but by the person renting the channel, or by a manager. Assembling that by hand from an event log is half a day. A printable report with uptime as a percentage, every outage with dates, and traffic for the period ends the conversation in a minute.
One detail we got wrong ourselves first: a site must not be credited for time before it existed in the system. Otherwise a site added yesterday shows a flawless hundred percent for the month, and that is not a measurement, it is an absence of records.
git clone https://github.com/maximdr86/tikpilot
cd tikpilot && cp .env.example .env
docker compose up -dFrequently asked
How is this different from Zabbix?
Zabbix is general purpose and watches anything, but it has to be configured. This is only about MikroTik and works as soon as the sites are added. If your Zabbix is already set up, there is no reason to replace it.
Is SNMP needed?
No. The panel talks to the RouterOS API, the same one it uses for bulk actions.
How much does it cost to run?
A VM with one core and a gigabyte of memory is plenty. The bottleneck is not the server, it is the links to the sites.
Can a contractor be given access?
Yes. Permissions are granted one by one, and an account can be limited to certain groups or devices. There is also a public status page with no login: site names and up or down, nothing else.